GTA Real Estate Market June 2025
GTA Real Estate Market Performance June 2025
Insights from Team Kalia – Your Trusted Mississauga Realtors
As per TRREB’s May Market Watch Report, the Greater Toronto Area (GTA) housing market in June 2025 presented a mix of opportunity and caution. With more listings of GTA homes for sale, moderate activity, and increased buyer leverage, this summer is shaping up to be a favourable time, especially for those homebuyers looking to enter the market or upgrade.
Let’s dive into the latest numbers and what they mean for you.
Key GTA Market Stats – June 2025
Total Sales: 6,243 (down 2.4% from June 2024)
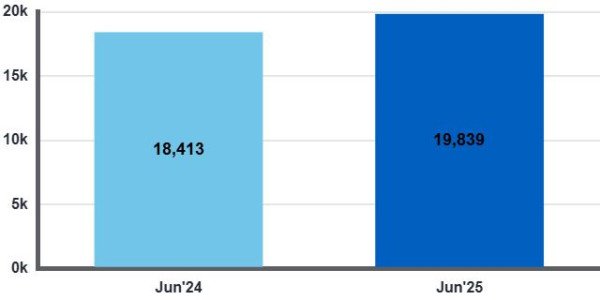
New Listings: 19,839 (up 7.7% year-over-year)
Active Listings: 31,603 (up 30.8% year-over-year)
Average Selling Price: $1,101,691 (down 5.4% year-over-year)
Home Price Index Benchmark: $978,200 (down 0.9% month-over-month and 5.5% year-over-year)
Days on Market: Up approximately 30–40% compared to last year
These figures show a clear increase in listing inventory and longer time on the market, giving buyers more negotiating power.
Segment Snapshot: Home Types at a Glance
Detached Homes
- Average Price: $1,392,033
- Sales volume remains steady but price growth has slowed.
Semi-Detached
- Average Price: $1,089,751
- Modest drop in sales year-over-year.
Townhomes
- Average Price: $871,652
- Sales dipped slightly but townhomes continue to attract entry-level first time home buyers and move-up buyers.
Condos
- Average Price: $696,424
- Condo market remains soft, with fewer sales compared to last year, a possible opportunity for buyers and real estate investors.
Regional Market Insights
City of Toronto (416)
- Sales: 2,319 (up 3.4% year-over-year)
- Average Price: $1,132,709
905 Region
- Sales: 3,924 (down 5.6% year-over-year)
- Average Price: $1,083,361
Buyers in both 416 and 905 areas are benefiting from increased options and a more relaxed pace, while home sellers must price homes competitively to attract offers.
What’s Driving Market Trends?
Lower Interest Rates: The Bank of Canada has cut rates by 2.25% since June 2024, offering some relief on borrowing costs.
Increased Inventory: More listings are entering the market, keeping price growth in check.
Economic Outlook: Buyers remain cautious amid inflation and job market concerns.
TRREB notes that further rate cuts and improved affordability could support stronger market conditions later this year.
What This Means for You
For Buyers
This is your time. With more inventory and less competition, you can take your time, negotiate better deals, and potentially benefit from falling interest rates.
For Sellers
Success in today’s market comes down to strategic pricing, presentation, and marketing. Properties that show well and are priced right are still moving, especially in sought-after neighbourhoods.
For Investors
Condos and multi-unit properties present attractive long-term opportunities. With rental demand holding steady, this could be the right time to buy.
Team Kalia’s Advice
- Whether you’re buying, selling, or investing, here’s how to stay ahead:
- Get pre-approved so you know your budget before making a move.
- Watch the Bank of Canada’s next interest rate decision (July 30), it may influence buyer activity.
- For buyers, take advantage of the slower pace and wider selection. For sellers, stand out with the right pricing and presentation.
Let’s Talk About Your Real Estate Goals
At Team Kalia, we bring over two decades of trusted experience in the Mississauga and GTA markets. We understand local trends and tailor every strategy to your unique needs, whether you’re buying your first home, upsizing, downsizing, or investing.
Call us today at 905-339-5111
Let’s make your next move a confident one!
GTA Real Estate Market June 2025 Stats
| Average Home Prices by City June 2025 | ||||
| Detached | Semi Detached | Condo Townhouse | Condo Apartment | |
| Burlington | $1,456,544 | $939,688 | $789,563 | $586,921 |
| Milton | $1,259,638 | $983,647 | $733,125 | $614,889 |
| Oakville | $1,970,925 | $1,174,438 | $845,288 | $832,090 |
| Brampton | $1,097,328 | $859,395 | $626,144 | $459,414 |
| Mississauga | $1,442,898 | $991,926 | $766,204 | $576,909 |
| City of Toronto | $1,641,868 | $1,278,434 | $827,936 | $731,232 |
2022-2026 GTA Monthly Home Sale Stats as per TRREB Reports
| Avg. Home Price | Home Sales | ||||||||||||||
|---|---|---|---|---|---|---|---|---|---|---|---|---|---|---|---|
| 2022 | 2023 | 2024 | 2025 | 2026 | 2022 | 2023 | 2024 | 2025 | 2026 | ||||||
| Jan | $1,242K | $1,037K | $1,028K | $1,041K | $973K | 5,594 | 3,082 | 4,308 | 3,821 | 3,082 | |||||
| Feb | $1,334K (Peak) | $1,096K | $1,114K | $1,086K | 9,027 | 4,754 | 5,792 | 4,128 | |||||||
| Mar | $1,298K | $1,107K | $1,125K | $1,090K | 10,861 | 6,867 | 6,741 | 4,959 | |||||||
| Apr | $1,250K | $1,152K | $1,155K | $1,106K | 7,940 | 7,487 | 7,301 | 5,558 | |||||||
| May | $1,210K | $1,195K | $1,167K | $1,121K | 7,226 | 8,959 | 7,205 | 6,201 | |||||||
| Jun | $1,145K | $1,181K | $1,164K | $1,102K | 6,422 | 7,429 | 6,397 | 6,203 | |||||||
| Jul | $1,072K | $1,116K | $1,113K | $1,051K | 4,868 | 5,219 | 5,498 | 6,069 | |||||||
| Aug | $1,093K | $1,082K | $1,077K | $1,021K | 5,585 | 5,251 | 5,092 | 5,196 | |||||||
| Sep | $1,086K | $1,118K | $1,112K | $1,059K | 4,998 | 4,605 | 5,155 | 5,592 | |||||||
| Oct | $1,087K | $1,123K | $1,135K | $1,054K | 4,929 | 4,611 | 6,784 | 6,138 | |||||||
| Nov | $1,079K | $1,077K | $1,110K | $1,039K | 4,507 | 4,194 | 5,948 | 4,997 | |||||||
| Dec | $1,050K | $1,084K | $1,060K | $1,006K (Bottom) | 3,090 | 3,419 | 4,058 | 3,697 | |||||||
| Annual | $1,190K | $1,126K | $1,120K | $1,067K | $973K | 75,047 | 65,877 | 70,279 | 62,433 | 3,082 | |||||
Year-Over-Year Summary (June Comparison)
| GTA | 2025 | 2024 | %age change |
|---|---|---|---|
| Sales (All Home Types) | 6,243 | 6,397 | -2.4% |
| New Listings | 19,839 | 18,413 | 7.7% |
| Active Listings | 31,603 | 24,169 | 30.8% |
| Average Price | $1,101,691 | $1,164,491 | -5.4% |
| Average LDOM | 26 | 20 | 30.0% |
| Average PDOM | 42 | 30 | 40.0% |
Average Listing Days on Market (Avg. LDOM) refers to the average number of days sold listings were on the market. Average Property Days on Market (Avg. PDOM) refers to the average number of days a property was on the market before selling, irrespective of whether the property was listed more than once by the same combination of seller and brokerage during the original listing contract period.
| 5 Year GTA Sales & Avg Price Chart | ||
|---|---|---|
| Year | Sales | Avg Price |
| 2019 | 87,747 | $819,153 |
| 2020 | 95,066 | $929,636 |
| 2021 | 121,712 | $1,095,475 |
| 2022 | 75,047 | $1,190,749 |
| 2023 | 65,936 | $1,126,591 |
| 2024 | 67,610 | $1,117,600 |
| 2025 (YTD) | 30,967 | $1,095,578 |
Year over Year Transactions

Month over Month Transactions

Year over Year Avg Price

Month over Month Avg Price

Year over Year Listings

Year over Year Days on Market