GTA Real Estate Market March 2025
GTA Real Estate Market Performance March 2025
Signs of Affordability and Opportunity
As per TRREB’s February Market Watch Report, homeownership in the Greater Toronto Area (GTA) became more affordable in March 2025 compared to the same time last year. With both borrowing costs and home prices trending downward, monthly mortgage payments have become more manageable for households looking to enter the market.
TRREB notes that the combination of lower interest rates and more inventory is creating favourable conditions for buyers. Expectations of further rate cuts this Spring, along with increased choice in the market, are giving home buyers more negotiating power.
While affordability is improving, many buyers appear to be cautiously waiting on the sidelines. Ongoing trade uncertainty and the upcoming federal election are prompting some households to adopt a wait-and-see approach. Confidence in the broader economy and job stability will play a crucial role in reigniting home-buying activity over the coming months.
Sales and Listings: A Shift in Momentum
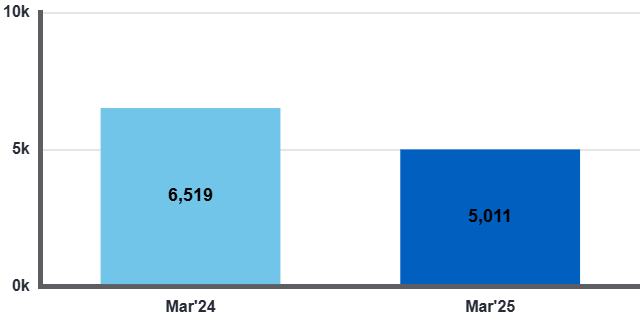
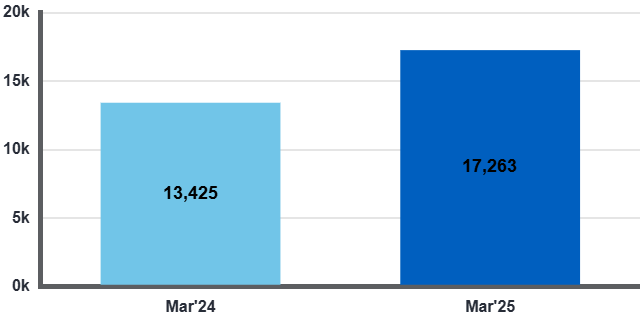
In March 2025, GTA REALTORS® reported 5,011 home sales through TRREB’s MLS® System, a 23.1% decline compared to March 2024. However, new listings saw a significant increase, rising 28.6% year-over-year to 17,263. This boost in available inventory is giving buyers more options and influencing more balanced market conditions.
On a seasonally adjusted basis, March sales dipped slightly compared to February 2025, indicating some short-term hesitation from buyers.
Home Prices: Trending Downward
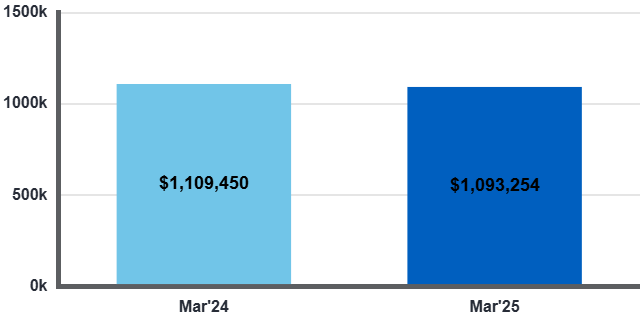
The MLS® Home Price Index (HPI) Composite Benchmark dropped by 3.8% year-over-year in March 2025. The average selling price across the GTA stood at $1,093,254, down 2% compared to March 2024. Month-over-month, the HPI Composite showed a slight decline while the average selling price remained flat.
This softening in home prices, coupled with easing borrowing costs, reflects a window of opportunity for buyers looking to enter or move up in the market.
Housing and Policy: A Key Election Topic
TRREB also emphasized that while much of the current policy focus is on Canada’s trade relationships, housing remains a top priority across party platforms. Polling shows that access to affordable housing continues to be a key concern for Canadians. As TRREB highlights, building more housing will be essential for economic growth in the years ahead.
What This Means for You
If you’re planning to buy, sell, or invest in GTA real estate, this could be an opportune time to act, especially before anticipated interest rate cuts and potential post-election shifts in housing policy. The market is showing early signs of balance, with more listings and manageable prices for buyers.
At Team Kalia, we’re here to help you navigate the evolving real estate landscape with confidence. Whether you’re a first-time buyer, move-up buyer, downsizer, or investor, our experience and local expertise can guide you every step of the way.
As the market continues to evolve, home buyers and home sellers should stay informed and work with experienced professionals to navigate changing conditions.
Get in touch with us today to discuss your real estate goals!
GTA Real Estate Market March 2025 Stats
| Average Home Prices by City March 2025 | ||||
| Detached | Semi Detached | Condo Townhouse | Condo Apartment | |
| Burlington | $1,544,657 | $911,254 | $848,375 | $607,059 |
| Milton | $1,250,672 | $1,011,111 | $814,167 | $582,225 |
| Oakville | $1,957,714 | $1,111,541 | $838,444 | $680,445 |
| Brampton | $1,136,109 | $901,697 | $656,450 | $479,395 |
| Mississauga | $1,561,922 | $1,003,548 | $778,988 | $583,918 |
| City of Toronto | $1,723,489 | $1,337,498 | $825,222 | $716,460 |
2022-2026 GTA Monthly Home Sale Stats as per TRREB Reports
| Avg. Home Price | Home Sales | ||||||||||||||
|---|---|---|---|---|---|---|---|---|---|---|---|---|---|---|---|
| 2022 | 2023 | 2024 | 2025 | 2026 | 2022 | 2023 | 2024 | 2025 | 2026 | ||||||
| Jan | $1,242K | $1,037K | $1,028K | $1,041K | $973K | 5,594 | 3,082 | 4,308 | 3,821 | 3,082 | |||||
| Feb | $1,334K (Peak) | $1,096K | $1,114K | $1,086K | 9,027 | 4,754 | 5,792 | 4,128 | |||||||
| Mar | $1,298K | $1,107K | $1,125K | $1,090K | 10,861 | 6,867 | 6,741 | 4,959 | |||||||
| Apr | $1,250K | $1,152K | $1,155K | $1,106K | 7,940 | 7,487 | 7,301 | 5,558 | |||||||
| May | $1,210K | $1,195K | $1,167K | $1,121K | 7,226 | 8,959 | 7,205 | 6,201 | |||||||
| Jun | $1,145K | $1,181K | $1,164K | $1,102K | 6,422 | 7,429 | 6,397 | 6,203 | |||||||
| Jul | $1,072K | $1,116K | $1,113K | $1,051K | 4,868 | 5,219 | 5,498 | 6,069 | |||||||
| Aug | $1,093K | $1,082K | $1,077K | $1,021K | 5,585 | 5,251 | 5,092 | 5,196 | |||||||
| Sep | $1,086K | $1,118K | $1,112K | $1,059K | 4,998 | 4,605 | 5,155 | 5,592 | |||||||
| Oct | $1,087K | $1,123K | $1,135K | $1,054K | 4,929 | 4,611 | 6,784 | 6,138 | |||||||
| Nov | $1,079K | $1,077K | $1,110K | $1,039K | 4,507 | 4,194 | 5,948 | 4,997 | |||||||
| Dec | $1,050K | $1,084K | $1,060K | $1,006K (Bottom) | 3,090 | 3,419 | 4,058 | 3,697 | |||||||
| Annual | $1,190K | $1,126K | $1,120K | $1,067K | $973K | 75,047 | 65,877 | 70,279 | 62,433 | 3,082 | |||||
Year-Over-Year Summary (March Comparison)
| GTA | 2025 | 2024 | %age change |
|---|---|---|---|
| Sales (All Home Types) | 5,011 | 6,519 | -23.1% |
| New Listings | 17,263 | 13,425 | 28.6% |
| Active Listings | 13,633 | 12,450 | 9.5% |
| Average Price | $1,093,254 | $1,120,984 | -2.5% |
| Average LDOM | 24 | 20 | 20.0% |
| Average PDOM | 25 | 29 | -13.8% |
Average Listing Days on Market (Avg. LDOM) refers to the average number of days sold listings were on the market. Average Property Days on Market (Avg. PDOM) refers to the average number of days a property was on the market before selling, irrespective of whether the property was listed more than once by the same combination of seller and brokerage during the original listing contract period.
| 5 Year GTA Sales & Avg Price Chart | ||
|---|---|---|
| Year | Sales | Avg Price |
| 2019 | 87,747 | $819,153 |
| 2020 | 95,066 | $929,636 |
| 2021 | 121,712 | $1,095,475 |
| 2022 | 75,047 | $1,190,749 |
| 2023 | 65,936 | $1,126,591 |
| 2024 | 67,610 | $1,117,600 |
| 2025 (YTD) | 12,856 | $1,074,952 |
Total Residential Transactions - Year-Over-Year
-23.1% compared to last year
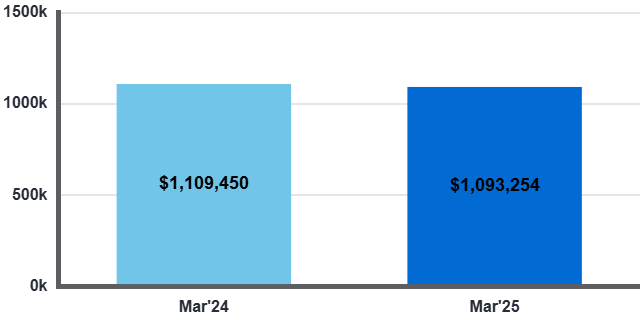
Average Selling Price - Year-Over-Year
-1.5% compared to last year
Total New Listings - Year-Over-Year
28.6% compared to last year
Days on Market Property / Year-Over-Year
-13.8% compared to last year